Trailer Pump Operation and Performance (Part 1 of 3)
By Isaiah Helm, SRS Crisafulli Applications Engineer
1 min read

By Isaiah Helm, SRS Crisafulli Applications Engineer
SYSTEM CURVES
Just as a plot can be made of pump performance, a graph can be made of the resistance to flow of the piping system through which the pump must drive the fluid. Using the same head-flow coordinates as the pump performance curve, the figures below can be created. The curve in Figure 1 represents a system in which there is no static head. The curve in Figure 2 shows the loss curve displaced upward an amount equal to the static head.
Figure 1: a system in which there is no static head
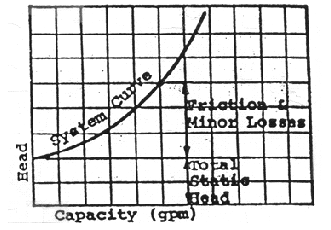 Figure 2: the loss curve displaced upward an amount equal to the static head
After a pump is installed on the basis of a certain head and capacity requirement, it may be desired to vary the pump's performance. A controllable restriction such as a valve can be placed in the discharge line to vary the system friction loss (dynamic head). The operating point of the pump may then be moved along its performance curve by opening or closing the valve. Figure 3 below demonstrates the response to changes in head.
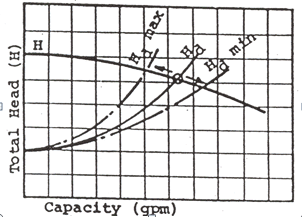
Figure 3: the response to changes in head
In most systems, the static head will vary as a pond is drained or a river level rises and falls. As the vertical distance from intake to discharge increases, the static head also increases, effectively raising the system curve. The system head is then represented as a pair of parallel curves intercepting the performance curve, as shown in the figure 4 below. These two curves determine through what range of capacity and total head the pump will be expected to operate.
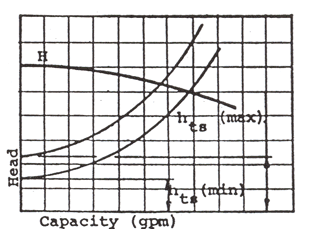
Figure 4: parallel curves intercepting the performance curve
An example system curve is shown below for a 4-inch L-series pump. The static head (lift) is 7 feet, and it is pumping through 50 feet of rubber discharge tubing. The TDH increases from the base value of 7 feet as the flow increases and more energy is lost to friction between the water and discharge tubing. If the impeller is spun at 540 RPM, the intersection of the 540 RPM curve and the system curve designates the expected operating point. In this example situation, the pump will produce nearly 600 gallons per minute out the end of the 50 foot discharge hose.

Request a consultation with one of our Applications Engineers/Specialists.
Watch a Crisafulli Trailer Pump Video.
Watch a Crisafulli pumps slideshow.

By Isaiah Helm, SRS Crisafulli Applications Engineer

By Isaiah Helm, SRS Crisafulli Applications Engineer

By Travis Stroh, SRS Crisafulli Applications Specialist